Do you want to calculate your free breakeven ROAS/MER? Do it now using our free calculator.
Introduction
A question that is quite common among e-commerce brand managers is: ” How much budget can we spend on advertising? ”.
This is certainly a legitimate question but in a sense erroneous since it does not take into account the danger of overspending (overspending), which reduces margins and consequently profits.
A more ”sensible” question is: ”How much budget can we allocate in advertising so as to achieve profit? ”
The probably more correct question to ask is ” When will my next euro invested in advertising stop generating profits for me? ”.
The purpose of this question is as follows: to avoid overspending, which burns revenue by taking us into loss.
Fortunately, in defining the ideal ad spend, an extremely valuable ally for advertisers comes into play known as the MER (Marketing Efficiency Ratio), also known as the “overall ROAS,” which allows them to ”cover up” some of the shortcomings of a much better-known indicator: the Campaign ROAS (Return on Ad Spend).
So let us look together at the concept of MER (Overall Roas), the formula for calculating it, and the limitations of the ROAS indicator that it remedies.

Definition of MER and the limits of ROAS
The MER , an English acronym for Marketing Efficiency Ratio ( I ndex of Marketing Efficiency in Italian), also called Overall ROAS measures the overall performance of efforts made in various digital marketing campaigns and it is simply The ratio of total revenues to total expenses incurred, considering all the various channels and advertising campaigns, in a given time period.
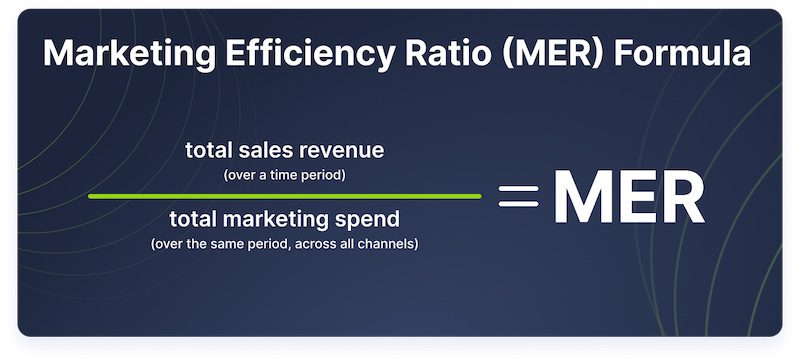
Assuming total marketing expenditure seems to be 100,000 euros against total sales revenue of 300,000 euros, the MER will simply be 3x.
MER = 300,000/100,000 = 3
This number indicates that total revenues are worth three times the marketing expenditure incurred.
The ROAS , an English acronym for Return On Advertising Spend ( Return on Advertising Spending in Italian) measures the return generated by one or more specific advertising campaigns or a single advertising channel, taking into account only the advertising costs and revenues of a specific advertising channel or campaign .
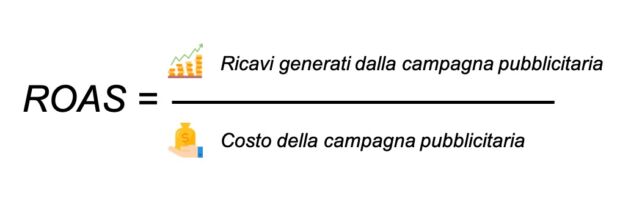
Assuming advertising investments of 10,0000 euros with revenues from the same campaigns of 40,000 euros, ROAS simply amounts to 4x (or 400% if expressed as a percentage).
ROAS = 40,000/10,000 = 4
This value indicates that for every euro invested in such campaigns, four euros came back to me in the form of revenue.
Please note. : MER takes into account total marketing expenses and revenues incurred in a given time interval, while ROAS only takes into account expenses and revenues from certain advertising campaigns.
Although ROAS is undoubtedly the most beloved indicator for most advertisers as it provides immediate insights into campaign performance, it has some limitations such that a more comprehensive analysis with the support of the MER indicator is required. We mention 3 of the most relevant limitations of ROAS:
- ROAS does not take into account all the revenue that a marketing campaign can generate. A trivial example might be the following: let’s imagine that a user sees one of our web advertisements in June, is particularly impressed by that advertisement and the featured product or service, however, he or she does not decide to convert right away but the conversion occurs some time later. Although conversion is a direct result of a June campaign, it is likely that the ROAS considered in the analyses does not take this conversion into account. The reason is quite obvious: because the customer journey is quite varied and circuitous, ROAS finds it difficult by its very nature to measure all conversions attributable to a campaign.
- ROAS may not take into account the ”haloeffect” between two differentproducts. A halo effect refers to a customer’s preference for a brand’s product line due to positive experiences of buying other products from the same brand. Assume, as an example, a customer’s purchase of a coffee machine on the website of brand ”X” after viewing an advertisement on one of the many existing digital channels. Satisfied with the product and the buying experience provided by brand X, the same customer, after months, decides to buy from the same brand a product in a different category (e.g., a refrigerator). Once again, ROAS is unlikely to account for the halo effect among different product categories. In fact, the second purchase is directly related to the first purchase and thus to the campaign related to it.
- With the evolution of the privacy issue and the changes introduced by some major industry players (e.g., Apple with iOS 14), conversion tracking becomes even more complex and less effective, so ROAS, by not tracking all conversions, becomes less accurate.
Calculate your breakeven MER/ROAS using our free calculator

The Customer Acquisition Cost (CAC) and the Acquisition MER (aMER).
We continue our journey in discovering how to define the ideal advertising budget.
We then defined MER as a multiplier given by the ratio of total marketing revenue to total marketing expenditures. However, it becomes central to make a distinction between expenditures incurred to acquire new customers and expenditures incurred to maximize retention of existing customers: most marketing budgets are spent on acquiring new customers since acquisition costs (CAC) are much higher than retention costs.
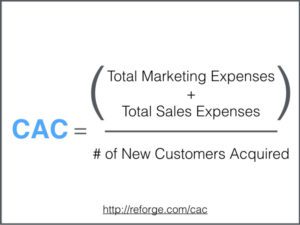
Customer Acquisition Cost (CAC) simply measures the total cost incurred by a company to acquire new customers. The CAC is thus given by the ratio of total marketing expenditures incurred to acquire new customers to the number of new customers acquired in a given time frame.
Thus taking into account the revenue derived exclusively from new customers, it becomes possible to calculate Acquisition MER (aMER) as the ratio of revenue from newly acquired customers to total advertising expenditures:

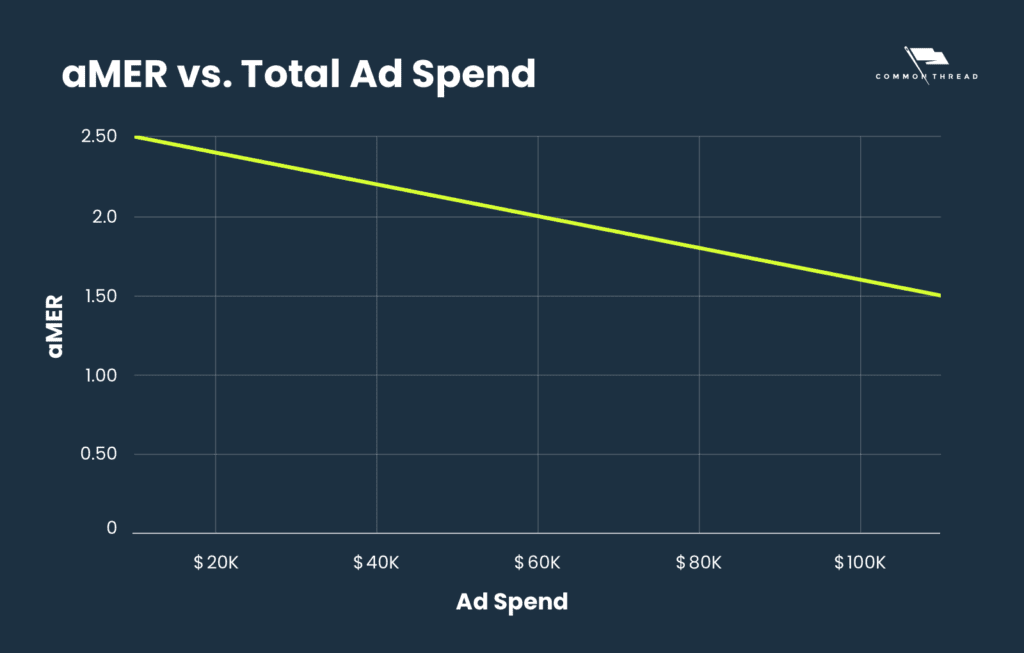
There is an inverse relationship between advertising expenditure and aMER (volume and efficiency): a marginal increase in spending corresponds to a progressive decrease in Acquisition MER.
We will define such aMER as blended aMER .
Considering instead the marginal changes in both revenue from new customers and advertising spending, we will speak of marginal aMER . In formula:
- Blended aMER = Total Acquired Revenue ÷ Total Ad Spend
- Marginal aMER = Marginal Acquired Revenue ÷ Marginal Ad Spend
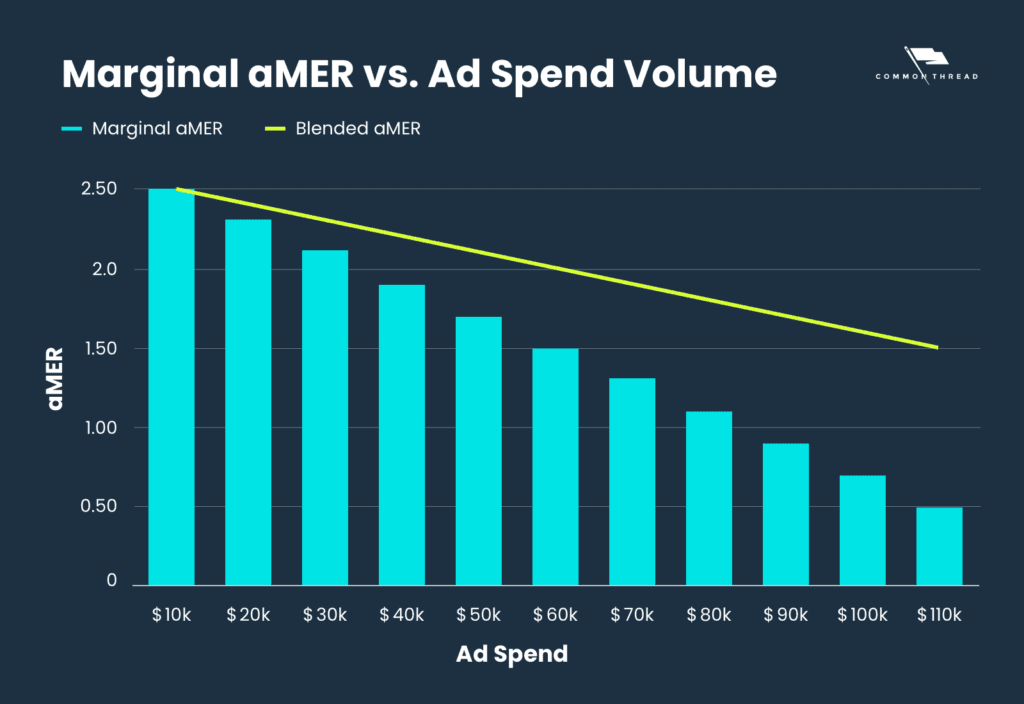
We note in the graph taken from Common Thread how at a marginal increase in Ad Spend of $10,000, the Marginal aMER falls faster than the Blended aMER. This is because when efficiency drops every extra dollar spent on advertising produces less revenue.
When will my next dollar invested in advertising stop generating profits?
To answer this question, the last input we need is the break-even point.
Assuming a gross margin of 70% and an incremental expenditure of $10k: the marginal acquisition MER breakeven target will be 1.5 while the blended acquisition MER will be 2.0.
Let us look at the following graph with main focus on the values of aMER and Contribution Margin (difference between sales revenue and variable cost of quantity sold of a product):
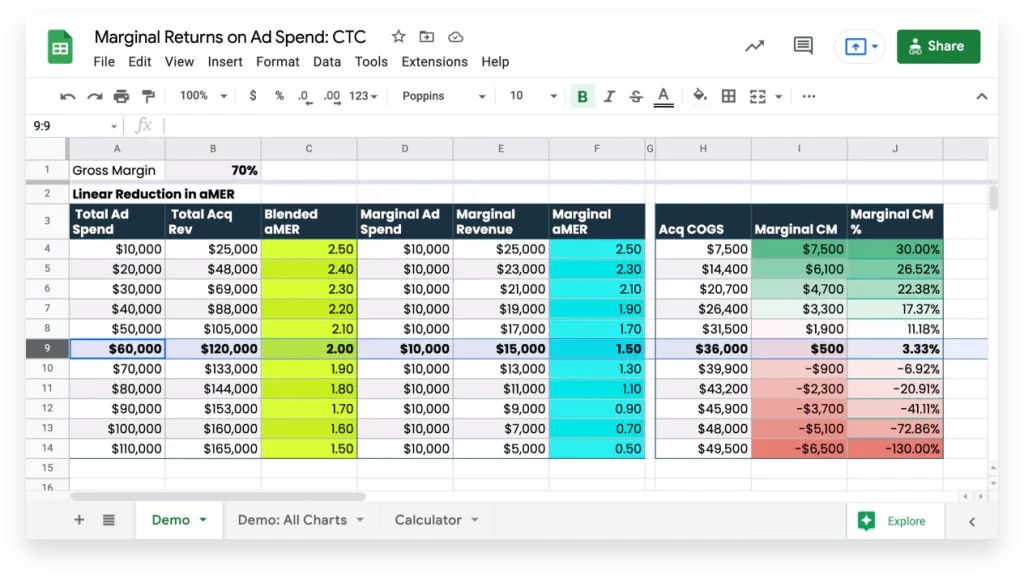
We note how at a marginal increase (by $10k in the example) in advertising spending:
- It increases the value of revenue, but also increases the variable costs of products sold (COGS).
- Both MER values and thus marketing efficiency gradually decrease, but above all, the contribution margin decreases until it becomes negative. A negative contribution margin indicates that the product is no longer profitable as the variable costs of producing and selling products exceed the resulting sales revenue.
It is clear from the graph shown that, in the example considered, over 60,000 euros of advertising expenditure is a loss. This value corresponds to a marginal aMER of 1.5 and a blendend aMER of 2.00.
In this way we answer the question we have been asking from the beginning: ” When will my next euro invested in advertising stop generating profits for me? ”.
Calculate your Breakeven MER/ROAS now using our free calculator.