Introduction to attribution models
In the world of digital marketing, understanding which touchpoints helped generate a conversion is critical to optimizing strategies and maximizing results.
However, this can be complex and confusing many times given the complexity of the customer journey and the obstacles related to tracking (cookies, privacy policy side limitations etc..).
To our aid, fortunately, come the so-called ” attribution models ”.
They provide a methodology by which to attribute credit for a conversion among the different touchpoints that occurred and then led to the mentioned conversion (usually a purchase or contact).
Google Analytics 4 (GA4) offers a range of attribution models that allow us to evaluate different approaches to assign credit for a conversion to different customer interactions (e.g., clicks on an ad or organic content on social and/or search engines, website visits, clicks from email content etc.).
In this article, we will explore in detail the attribution models available in GA4 and how each affects the measurement of conversions.
In particular, we will see this through a practical (relatively simple) customer journey case so that we can more easily understand the different models that exist.

The main patterns of attribution in GA4
Therefore, conversion attribution means the merit of it attributed to a specific channel, where the user interacted.
Attribution models, as mentioned above, thus define a method by which credit is given for conversion to one channel over another.
In Google Analytics 4 we can find several, each with its own attribution logic.
It must be kept in mind that in the vast majority of cases, the user’s conversion path ( customer journey ) is rather tortuous and articulated, the result of several touchpoints that may occur before the final conversion.
To simplify, let us consider the following conversion path with three touchpoints as a practical example:
- A user sees one of our advertisements on Facebook Ads channels for the first time and intrigued clicks on it ending up on our product landing page. He inquires about the features of our product and offer, but does not purchase.
- After 1 day from the first visit, a Google Ads from the Display Network is shown to him within a website. The ‘user remembering the brand, clicks on the ad, returns to the website, searches for more information but does not proceed to purchase.
- After 3 days, the user is ready to buy, and in the search bar of the browser he/she types the address of our website, searches for the product, and finally completes the purchase.
In this case, which channel does GA4 attribute the conversion to?
It depends on the attribution model with which you do the analysis. The default one set on GA4 is the ”data-driven” attribution model,but there are several on which you can make different assessments.
NB: In GA3 the attribution model set by default was the one defined as ”last click.”
Let’s see together what different models exist and what their attribution logic is, considering the practical example above.
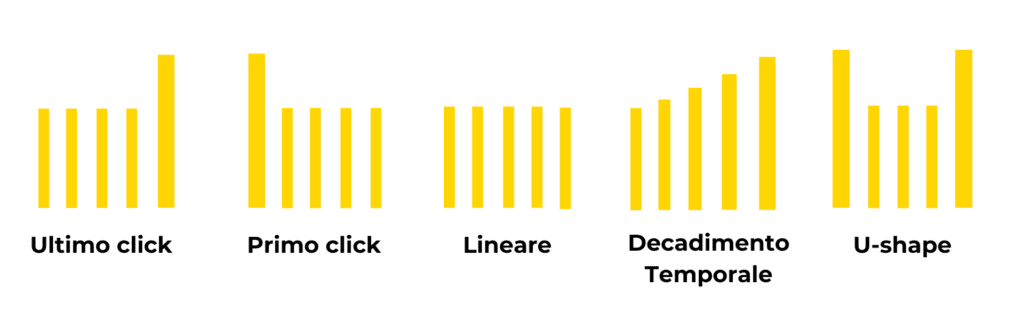
Last click attribution model.
The following logic applies in this model: the entire conversion is attributed to the last touchpoint/channel before purchase.
This is the attribution model set by default by Universal Analytics (GA3).
In our example, the entire merit of conversion is therefore attributed to the ”direct” channel, that is, the one that defines the direct visit to our website (when the user, precisely, searches for our website directly from the search bar of the browser).
Instead, the first two touchpoints (i.e., the Facebook ad and the Google ad) are completely ignored.

First click attribution model.
The first-click model assigns all the credit for conversion to the first touchpoint with which the user interacted .
It is, in fact, the opposite of last click.
In this case, in our example, the Facebook ad will receive full attribution because it was the first touchpoint the user interacted with.
Instead, the next two touchpoints (google ad and direct) are ignored.

Linear attribution model
In the linear model, conversion is allocated in equal parts among all user touchpoints during the conversion path.
Therefore, in our case, the conversion attribution would be divided equally between the Facebook ad, the Google Ads ad, and the website search (direct). In other words, all touchpoints are given equal credit for conversion.

”Time-decay” attribution model
This model attributes conversions according to the following logic: touchpoints closer to purchase receive more credit than those further away in time.
Thus, all touchpoints receive conversion credit, but to a greater extent the touchpoints closest to conversion.
In our example, touchpoint direct receives more credit for conversion, while Google Ads receives less credit than direct but more credit attributed to Facebook ads.

Location-based allocation model (U-Shape)
This model gives greater and equal credit to touchpoints that occur at the beginning and end of the conversion pathway, with a smaller share attributed to intermediate touchpoints
This model thus gives credit to all touchpoints, but to the first and last it gives equal and greater credit, and to intermediate touchpoints ua less credit.
In our example then, Facebook Ads and Direct will receive equal credit and a greater share of attribution than Google Ads which is the intermediate touchpoint.

”Data-driven” attribution model
This is the default model set by Google Analytics 4 and is one of the new features proposed by Google’s new analytics property.
This is an attribution model that seeks to replace those mentioned above, through an attribution logic of conversions based on statistical analysis of historical data so as to define the actual influence of various touchpoints prior to conversions.
In other words, Google’s algorithm thanks to the conversion data obtained compares the paths of users who generate conversions with those of users who do not, and the model identifies what factors are common in interactions with ads that generate conversions.
It is therefore a less intuitive but more effective model than the others.
In order to be, however, deemed reliable, it is necessary to have a good amount of conversions so as to provide as much data as possible to the algorithm.
If the amount of conversions is small, such a model loses effectiveness as the algorithm ”feeds” on the data derived from them.
Advantages and disadvantages of various allocation models
Each attribution model has advantages and disadvantages that must be considered when analyzing conversions. Here is a summary table:
| Attribution Model | Advantage | Disadvantage |
| Last Click | Simple to implement and understand. | It ignores previous touchpoints, providing only a limited view of the conversion path. |
| First Click (First Click) | Recognizes the importance of the first touchpoint. | It ignores subsequent touchpoints, providing only a limited view of the conversion path. |
| Linear | It considers all touchpoints, providing a complete view of the conversion pathway. | It does not account for differences in the effectiveness of touchpoints; it may overestimate the importance of some and underestimate others. |
| Time Decay (Time Decay) | Assigns more merit to touchpoints closer to purchase, recognizing the influence of recently interacting touchpoints. | It may underestimate the importance of the initial touchpoints that helped generate interest. |
| Data-Driven Attribution. | Customized and based on account-specific data, it offers accurate analysis of user interactions. | It requires a sufficient amount of historical conversion data and touchpoint interactions to provide reliable results. |
| Position-based attribution (U-Shape) | Recognizes the importance of multiple touchpoints in the conversion process. | It may be difficult to determine which intermediate touchpoints receive attribution because it is not a fairly balanced model. |
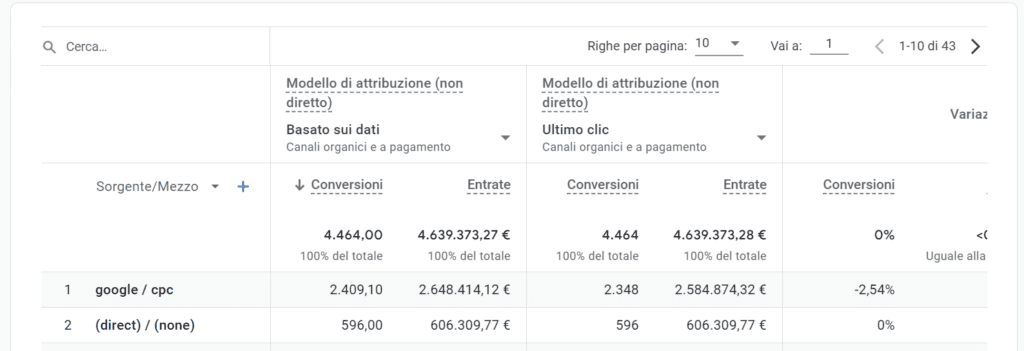
How to compare different attribution models in GA4.
Having defined the various attribution models, let’s briefly look at how to compare them in Google Analytics 4 in conversion analysis.
- Access your Google Analytics property 4.
- In the left column click on ” Advertisement ”
- In the section called ” Attribution ”, select ” Pattern Comparison ”.
- Select the attribution patterns you intend to compare and the reference dimension (example: Source/Mean), analyze and draw your own conclusions.
Conclusions: which among the attribution models to choose in data analysis?
This is about the classic ”$1 million question.” The answer, in fact, is not unique and depends on marketing objectives and understanding user behavior in the conversion path.
Certainly, the new ”data-driven” attribution model helps us have a benchmark for more accurate, data-driven attribution logic.
However, as mentioned, it needs to be supported by a significant amount of conversions to be effective, and this is not always the case, especially when we have only been in the market for a short time and cannot generate enough conversions.
In addition, it may be useful to assess conversions from a different perspective by evaluating the different logics of other existing attribution models, considering the advantages and disadvantages of each.
If you need support in managing and analyzing your Online Marketing activities, we at WebGas.net can help.
On a daily basis, we help entrepreneurs and marketing managers analyze data and devise ”data-driven” marketing strategies aimed at increasing sales and revenue in a sustainable way.
Contact us for a free initial consultation and find out how we can help you.